11th October 2026 · 18 min
Website Performance Optimization Tactics

A perfect Lighthouse score can be a poor business result. It may describe a carefully controlled desktop test of a marketing homepage while a customer on a mid-range Android phone waits for a checkout button, lead form, or logged-in dashboard to respond. Website performance optimization only matters when real people can complete important tasks quickly and reliably.
UK field data makes that distinction difficult to ignore. In a GOV.UK Real User Monitoring analysis covering April to May 2022, the median page-load time across all pages and devices was 0.455 seconds, yet only 20.9% of sites in the comparison dataset achieved a good mobile page-load score. GOV.UK reported that 83% of its visitors experienced a good page load under the Chrome User Experience Report definition, while some visitors waited as long as 2.35 seconds, according to the GOV.UK real-user monitoring analysis.
That's why experienced teams optimise journeys, not dashboards. They measure what happens on real devices and networks, then use lab tools to identify the technical cause.
Table of Contents
- The Problem with Chasing Perfect Lab Scores
- Decoding Core Web Vitals for Modern Applications
- Eliminating Render-Blocking Assets and JavaScript Bloat
- Architecting Caching and Hosting for Speed
- Connecting Real-User Speed to Commercial Outcomes
- Building a Sustainable Performance Culture
The Problem with Chasing Perfect Lab Scores
A perfect Lighthouse score can still hide a poor mobile journey. I've seen teams celebrate a fast homepage in a desktop run while the revenue path stays slow on an actual phone, after consent tools, tag managers, chat widgets, and app code all compete for the same CPU time. Lab tests are good at exposing technical causes under controlled conditions. They are far less reliable as a proxy for whether a customer can finish the task that matters.

Desktop confidence can hide mobile failure
In practice, the gap usually appears on mobile first. UK browsing habits and acquisition patterns make that hard to ignore, especially where paid traffic lands on pages loaded with testing scripts, personalisation, tracking, and large media. A page can post a strong lab result on a well-provisioned machine, then feel hesitant on a mid-range Android device because the bottleneck is no longer network transfer alone. It is parse time, compile time, execution time, and the browser trying to paint something useful while several non-critical requests fight for priority.
That is why “the page loaded” is often the wrong success condition. For ecommerce, the question is whether a shopper can select a variant and add to basket without delay after the first tap. For lead generation, it is whether the form becomes responsive quickly enough to keep intent. In SaaS, the key test is whether a signed-in user can open a workspace, trigger an action, and get confirmation without the interface stalling. A score in the nineties does not protect any of those journeys if the interaction layer is still heavy.
Homepage reporting also gets too much attention because it is visible and easy to benchmark. The expensive problems often sit deeper in the stack:
- Ecommerce: product detail pages, basket, checkout, payment callbacks
- Lead generation: landing pages with embedded forms, validation, and consent flows
- SaaS: login, dashboard bootstrap, search, save actions, and state updates
- Account journeys: settings, balances, document upload, and regulated task completion
Measure those routes separately. Segment by device class, network quality, geography, and whether the user is new or authenticated. The same GOV.UK monitoring evidence noted earlier makes the underlying point clearly enough. Median performance can look healthy while slower visits still cluster on the devices and conditions that matter commercially.
Practical rule: Use Lighthouse to find causes. Use real-user data to decide what deserves engineering time.
The target is reliable task completion for the slower part of the audience, not a perfect badge in a report. That usually means making trade-offs. Ship less JavaScript on first view. Defer anything that does not help the current journey. Protect the main thread during interactions. Optimise the route that drives revenue, leads, retention, or successful product use before polishing a synthetic score.
Decoding Core Web Vitals for Modern Applications
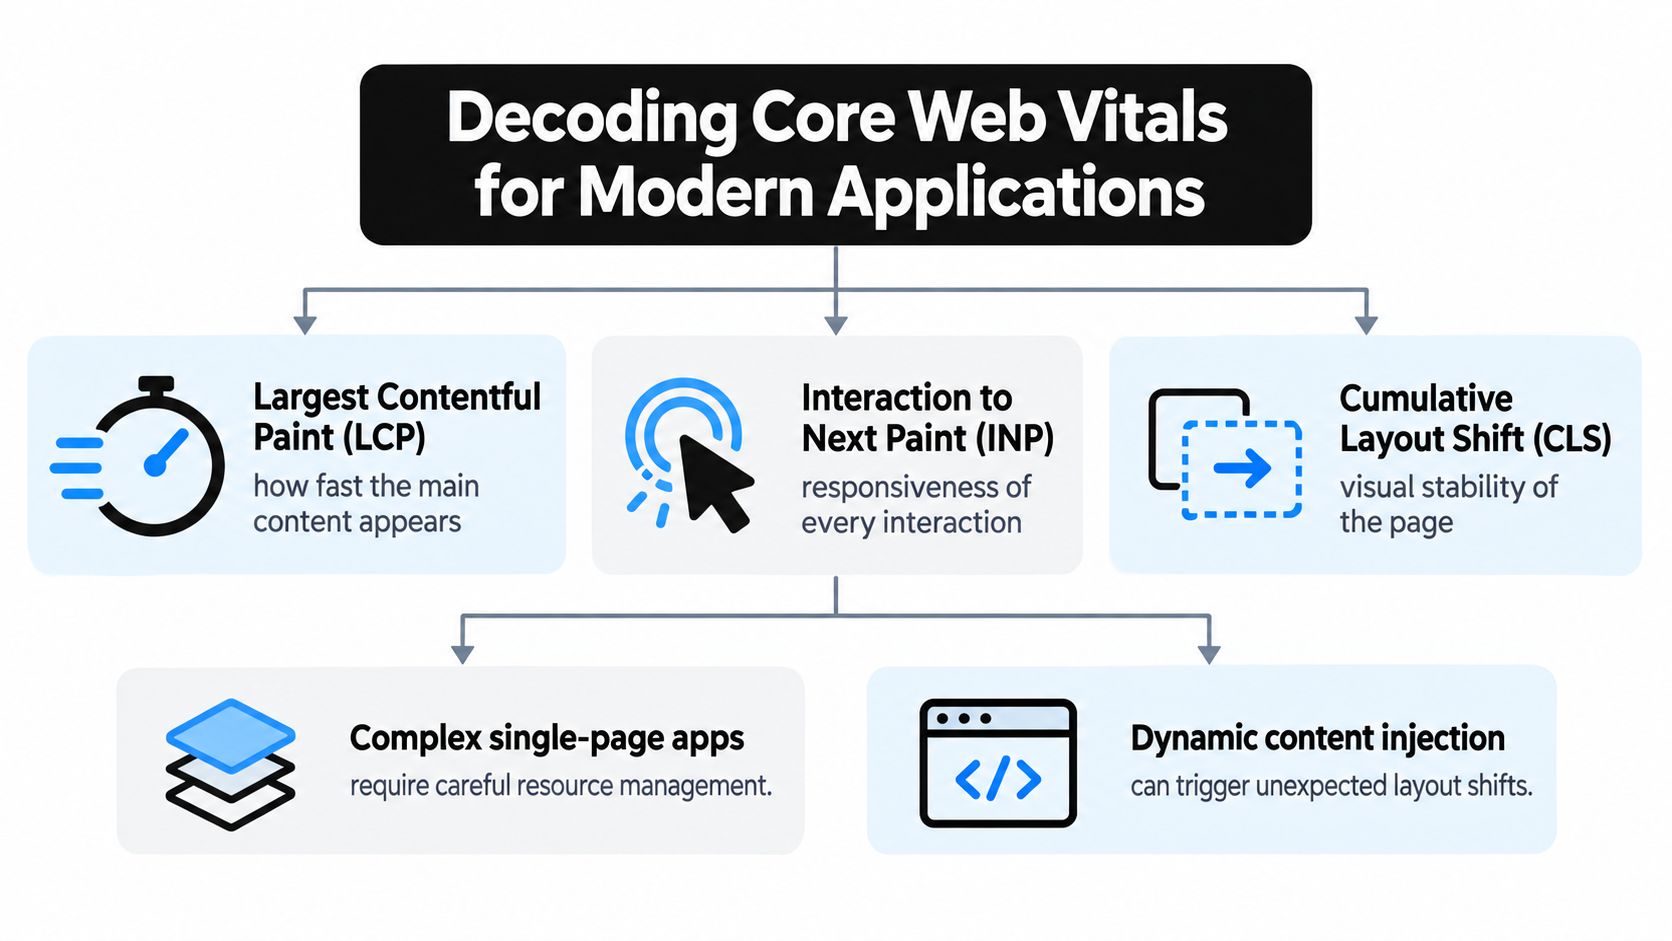
Core Web Vitals matter when each metric maps to a failure a customer can feel. Largest Contentful Paint is about when the main content becomes visible. Interaction to Next Paint is about whether the interface responds promptly after a tap, click, or keypress. Cumulative Layout Shift is about whether the page stays stable while people try to use it.
LCP measures useful content, not mere activity
LCP usually tracks the biggest thing that proves the page is ready enough to use. On an ecommerce product page, that is often the main product image. In SaaS, it might be the page heading, the first populated panel, or a loading state that helps the user orient themselves.
The common causes are familiar, but the fix depends on where the delay starts:
- Late discovery: the browser only finds the LCP asset after JavaScript runs or after a CSS background is parsed.
- Poor prioritisation: the LCP resource competes with scripts, fonts, or offscreen media that do not help the current view.
- Render blocking: CSS or synchronous JavaScript stops the browser from painting content that has already arrived.
- Slow server response: the document itself is late, so nothing else can start early enough.
Image compression helps only when image bytes are the real bottleneck. A lot of teams compress the hero image, ship the same dependency chain, and wonder why mobile LCP barely moves. Put the actual LCP resource in the initial HTML where possible, size it for the viewport that really sees it, avoid lazy-loading it, and preload it only when the browser is discovering it too late.
Be selective. If a product page has three hero variants in a carousel, preloading all three is a good way to waste bandwidth on the one connection you needed to protect. Preload the single srcset candidate that matches the LCP element, then let the rest load normally.
A UK ecommerce benchmark tested 460 pages from approximately 150 major retailers and reported an average performance score of 43/100. It found that 98% of pages failed Google's load-time standard, while only 1–2% achieved a good LCP score. Main content typically appeared after 12–14 seconds, compared with the 2.5-second LCP threshold.
INP exposes interaction debt
INP is where polished demos and real production apps part company. A page can look ready while the main thread is still tied up parsing a framework bundle, replaying hydration work, or recalculating a large component tree. On a mobile device with limited CPU headroom, that gap is obvious.
The user sees it in familiar moments. “Add to basket” does nothing for a beat. A filter tap highlights late. A save action freezes the interface before the confirmation appears.
Debug the interaction in three parts:
- Input delay: was the main thread already busy when the input happened?
- Handler work: did the event handler run more code than the action required?
- Presentation delay: did the resulting update trigger expensive layout, paint, or compositing work?
The best fixes are often architectural, not cosmetic. Remove dependencies that do not earn their place on that route. Split bundles by route and feature. Defer analytics that do not need to run before the first action. Virtualise long lists. Move CPU-heavy transformations into a Web Worker when that trade-off makes sense.
One practical example. If the Performance panel shows an analytics bundle adding delay after a filter change, defer that bundle and keep the interaction path focused on updating visible state first.
CLS damages confidence
CLS is less about aesthetics than trust. If a button shifts as someone taps it, or a consent banner drops in above the content, the page feels unreliable.
Reserve space before asynchronous content arrives. Give images and video explicit dimensions. Set geometry for adverts, embeds, and injected UI. Avoid inserting promotional banners above content that is already on screen. Font changes can also move text enough to disrupt reading or tapping, so test fallback metrics and font-display behaviour on the routes where typography changes layout.
Read the metrics together at the journey level. A placeholder that stabilises layout but pushes meaningful content lower can still hurt the experience. A preload that helps one asset can slow interaction if it steals bandwidth or CPU from the next action. The right fix is the one that makes the mobile journey feel faster and more dependable where users convert, search, submit, or save.
Eliminating Render-Blocking Assets and JavaScript Bloat
The browser follows a dependency chain. If the HTML arrives late, every later event is late. If the browser discovers the hero image only after a stylesheet or client-side render completes, image compression alone won't solve the delay.
Start with a waterfall for the actual route, not just the homepage. Use Chrome DevTools, Lighthouse, WebPageTest, and your RUM platform to identify the request that controls the next visible milestone.
Step one, establish the critical path
Record the sequence from navigation to usable content:
- HTML response: Check server response time, redirects, cache status, and document size.
- Stylesheets: Find CSS that blocks rendering, unused rules, and import chains.
- LCP resource: Identify the element and the moment its request begins.
- JavaScript execution: Inspect parse, compile, evaluation, and long tasks.
- Interaction readiness: Test the first meaningful tap, not just visual completion.
If the hero image is in a CSS background or injected after hydration, the browser discovers it late. Reference it in the initial markup when possible, use a correctly sized srcset, and reserve its dimensions. Add fetchpriority="high" only to the resource that directly controls LCP.
Step two, reduce what the route receives
Code-split by route and feature. A visitor reading a marketing page shouldn't download dashboard charts, checkout logic, a map library, or a rich text editor. Load those modules when the relevant route or interaction needs them.
Third-party code deserves a separate inventory because it often bypasses normal ownership. For every tag, record its purpose, pages, transfer cost, main-thread work, and failure behaviour. Remove abandoned experiments and duplicate analytics. Delay chat, video, maps, and review widgets until intent or proximity justifies them.
The fastest JavaScript is the JavaScript the browser never has to receive, parse, or execute.
Don't defer everything indiscriminately. Consent tooling, payment logic, cart behaviour, visible form validation, and essential account functionality may belong on the critical path. Test the business action after every change, including tracking, validation, and error handling.
Step three, shorten main-thread tasks
Use the Performance panel to locate long tasks during load and interaction. Break large synchronous loops into smaller units, yield between chunks, and move non-DOM computation to a Worker. Reduce unnecessary rerenders by narrowing state ownership and avoiding updates that invalidate an entire page.
Render-blocking CSS needs the same discipline. Extract only the styles required for the initial viewport, split route-specific styles, remove unused design-system rules, and avoid making a visible component wait for an unrelated experiment. Lab measurements show whether the waterfall changed. Field data confirms whether customers received the improvement.
Architecting Caching and Hosting for Speed
Infrastructure sets the starting point for every front-end optimisation. A browser can't download a stylesheet, discover an image, or execute application code until the server has returned enough HTML to begin the process.
Basic CDN caching
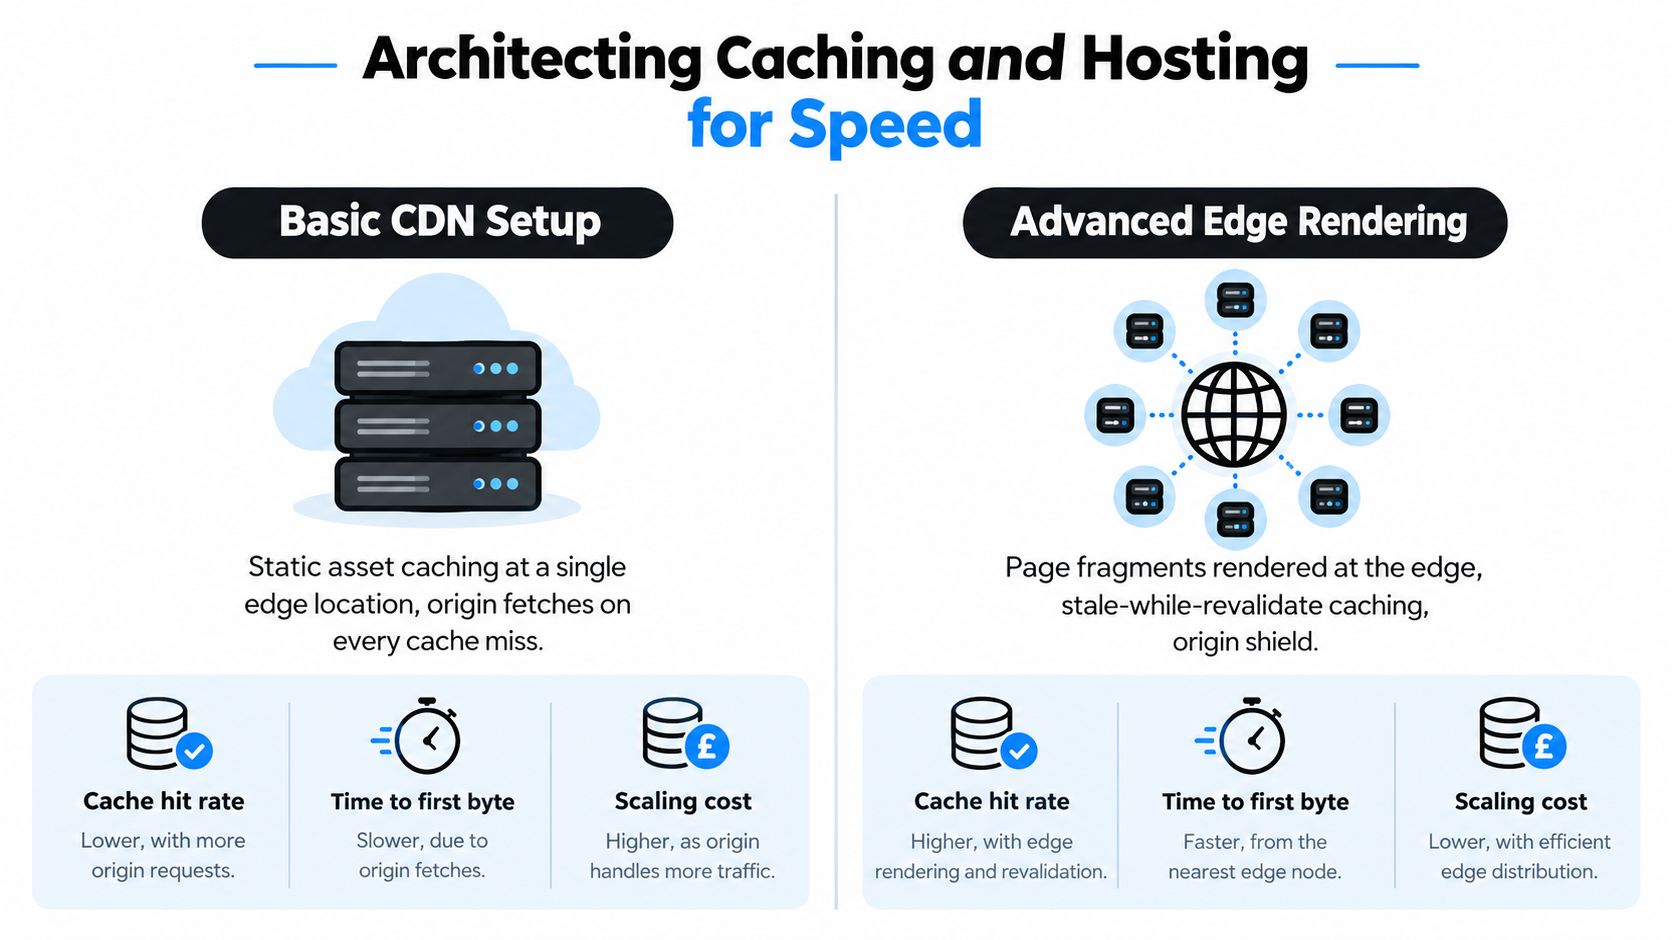
A conventional CDN is highly effective for immutable assets. Fingerprinted JavaScript, CSS, fonts, and images can be cached close to visitors, compressed, and delivered without repeatedly contacting the origin.
It's less powerful when it only caches static files while every document request still runs through a distant application server. A CDN can improve routing and connection handling, but it can't remove database work or slow server-side rendering from an uncached HTML response.
For public pages, consider full-page caching where personalisation isn't required. Marketing pages, documentation, product listings, and editorial content often tolerate cached HTML with controlled invalidation. Logged-in dashboards and account pages need a different model.
Edge rendering and fragment caching
Advanced edge architectures move selected decisions or page fragments closer to the visitor. They can combine stale-while-revalidate behaviour, an origin shield, and separately cached public fragments with dynamic account data.
That flexibility comes with operational trade-offs. Cache invalidation becomes more difficult, debugging spans multiple layers, and personalisation can accidentally reduce cacheability. Teams need clear rules for what varies by cookie, language, device, user state, or experiment.
For application decisions around public pages, APIs, and authenticated routes, review web application architecture patterns alongside performance requirements rather than selecting infrastructure in isolation.
| Architecture | Strength | Cost or risk |
|---|---|---|
| Origin rendering | Straightforward dynamic behaviour | Every request can pay application and database cost |
| CDN asset caching | Excellent for static resources | Doesn't necessarily accelerate HTML generation |
| Full-page caching | Very fast public journeys | Personalisation and invalidation require care |
| Edge rendering | Low-latency composition and flexible delivery | Higher complexity, observability, and cache-key risk |
SSR versus SSG for SaaS
Static site generation is a strong fit for stable marketing and documentation content. It avoids repeated render work and works naturally with CDN delivery.
Server-side rendering is more suitable when content must be generated per request, but it can raise server work and response time if the output isn't cached. Client-side rendering remains reasonable for highly interactive, authenticated applications, although teams should avoid forcing a large application runtime onto content that could arrive as HTML.
Choose the simplest architecture that makes the critical journey fast. Measure document response, cache hit behaviour, API latency, and client execution together. A faster CDN won't rescue an uncached page whose origin performs unnecessary work on every request.
Connecting Real-User Speed to Commercial Outcomes
Revenue rarely moves because a lab score went from good to perfect. It moves when a real customer on a real phone gets to search, product detail, basket, or lead submission without waiting through blocked rendering, delayed input, or a third-party script that steals the main thread.
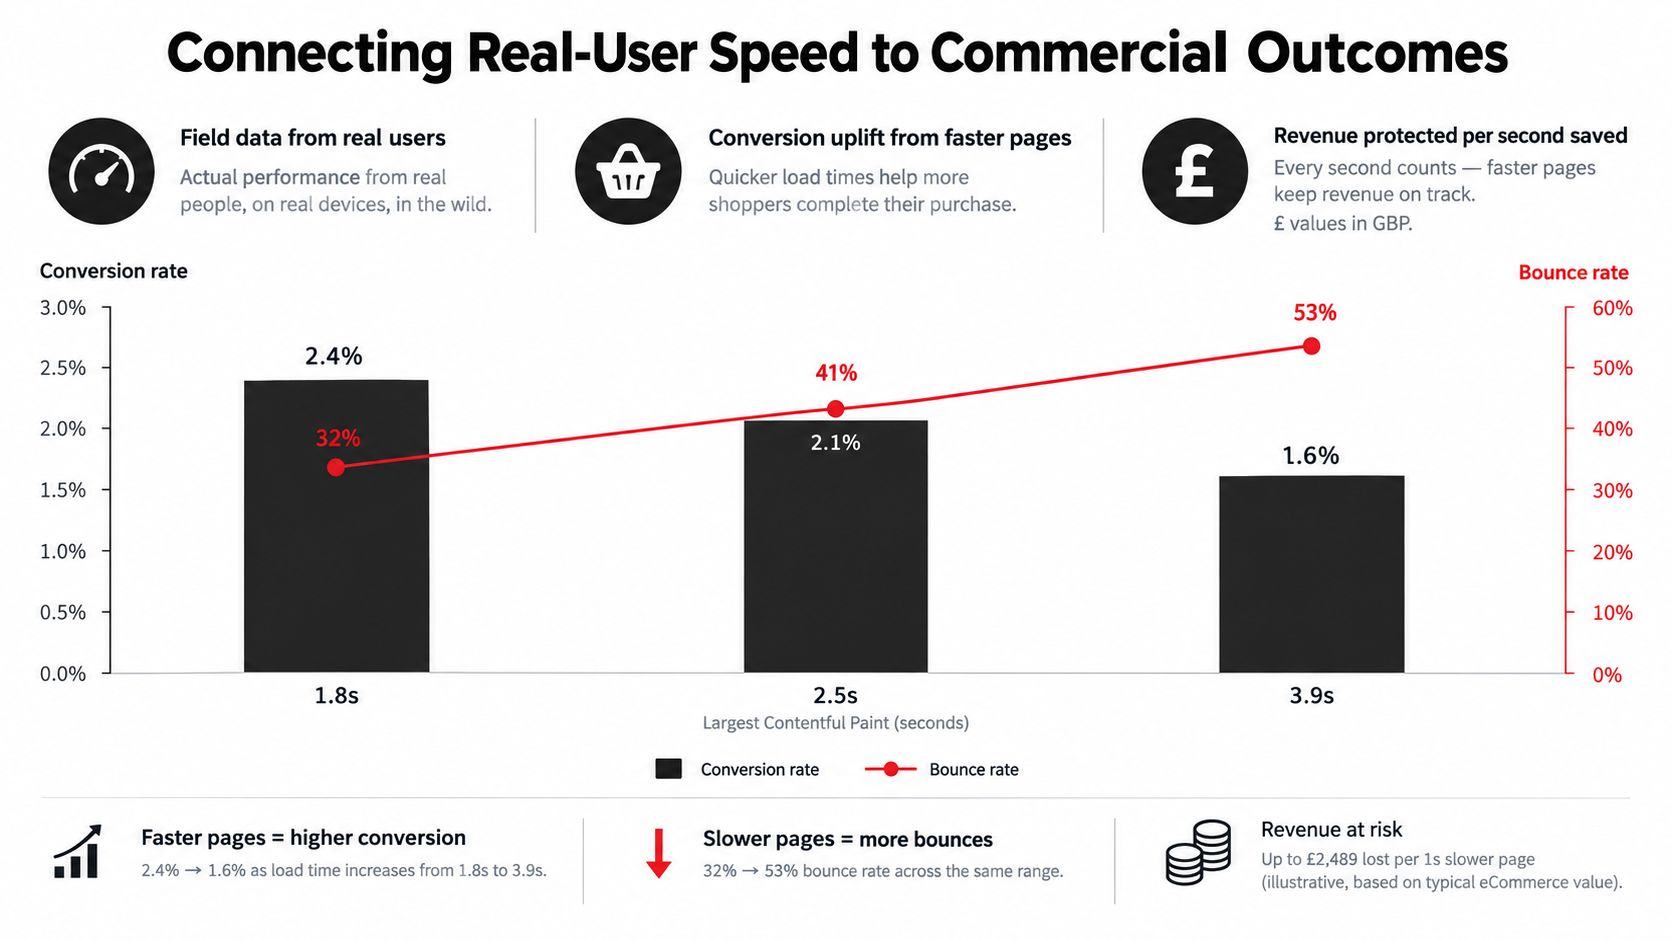
That is why commercial reporting needs to follow journeys, not just pages. Track what happens on the routes that make money or create pipeline, then connect experience metrics to actions such as product views, basket adds, form submissions, sign-ins, activation events, and successful payments. A homepage score can look healthy while the checkout, pricing page, or trial signup flow is losing demand on mid-range Android devices over busy mobile networks.
Build a useful RUM dataset
Start with route-level instrumentation and keep it practical. The dataset needs enough context to explain why a journey slowed down, but not so much noise that nobody trusts it or uses it.
A workable schema usually includes:
- Route and template: Product page, checkout, lead form, dashboard, or account area.
- Device context: Mobile or desktop, operating system, browser, and device class.
- Network context: Connection quality and region where available.
- Experience metrics: LCP, INP, CLS, document response timing, and error state.
- Business outcome: Conversion, abandonment, form completion, activation, or revenue per session.
Segment before you average anything. Desktop can flatter the picture. A fast cached landing page can hide a slow authenticated flow. Mean values also miss the slow tail, which is often where commercial friction shows up first. In practice, I would rather see mobile product-page LCP and basket-add rate by device class than a single blended score for the whole site.
The field-data lesson is straightforward. Real-user monitoring exposes the gap between tidy synthetic runs and what customers actually experience across browsers, devices, consent states, and network conditions. That makes it far more useful for deciding which performance work deserves engineering time.
Test commercial hypotheses carefully
Treat each performance change as a business hypothesis with a technical mechanism behind it. If a team removes a consent widget from the initial critical path, the question is whether the page becomes usable earlier and whether more users reach the basket or form completion without harming consent capture, attribution, or compliance.
Use an A/B test or a phased rollout where governance allows it. Compare LCP, INP, basket-add rate, conversion rate, revenue per session, error rate, and support contacts for the variant against the control over a fixed period. Fourteen days is often enough to catch weekday and weekend behaviour without letting unrelated release changes muddy the result.
Some speed wins are fake wins. Deferring a script can improve rendering but break analytics, personalisation, or checkout validation. Lazy-loading everything above the fold can reduce transfer weight while making the interface feel late. Commercial measurement keeps the team honest.
For teams examining how interface behaviour affects task completion, UI and UX design principles add useful context. Performance is part of the product experience. A well-designed control still fails commercially if it appears late, jumps during render, or ignores the first tap.
Building a Sustainable Performance Culture
A fast release can become a slow product when every feature adds another dependency, widget, API call, or rendering path. Performance needs an owner, a budget, and a deployment process that makes regressions visible before customers report them.
Start with a route-level baseline
Create a small set of representative journeys. Include a public landing page, a high-value acquisition route, a product or content detail page, checkout or lead submission, and an authenticated workflow where relevant.
Record lab and field results separately. Lab tests help reproduce a change under consistent conditions. RUM shows how the change behaves across actual devices, networks, browsers, and user states. Keep a history of LCP, INP, CLS, document response timing, JavaScript transfer, error rates, and business completion events.
A baseline should identify ownership. If LCP is slow because a CMS injects an oversized hero image, the content and platform teams need different actions from the team responsible for a blocked dashboard interaction.
Put budgets into CI and review
A budget turns an abstract concern into a release decision. Set limits for route JavaScript, CSS, image weight, third-party execution, request count, and key lab metrics. The exact thresholds should come from your product and field baseline rather than a generic score target.
Use Lighthouse CI or equivalent tooling in pull requests, then add bundle analysis to detect dependency growth. Fail builds only when the signal is reliable enough to avoid alert fatigue. A warning that engineers routinely ignore becomes background noise.
Use code review to ask practical questions:
- Dependency cost: Does this package serve a critical customer action?
- Loading point: Does it need to arrive before first interaction?
- Route scope: Can it be limited to one page or feature?
- Failure mode: What happens if the vendor or API is slow?
- Layout impact: Does asynchronous content reserve its space?
- Measurement: Which field metric and business event will confirm success?
Make performance part of product planning
Designers should specify loading, empty, error, and delayed states. Product managers should include performance acceptance criteria alongside functional requirements. Engineers should test realistic mobile conditions with the consent layer, analytics, feature flags, and third-party services enabled.
Run a recurring field-data review. Look for regressions after campaigns, redesigns, framework upgrades, new payment integrations, and analytics changes. Performance often degrades at the edges of the organisation because marketing, product, and engineering can each add a small cost without seeing the combined effect.
A performance budget only works when someone has authority to protect it.
For teams planning a new application or rebuilding an existing one, web application development guidance can help connect product scope, architecture, delivery, and operational support. The same principle applies whether you're shipping a marketing site, SaaS platform, ecommerce journey, or internal tool. Build measurement into the product from the first release instead of trying to reconstruct the customer experience later.
The practical order is clear: measure real users, identify the slowest consequential journey, remove waiting before polishing details, and verify the commercial result after release. Then repeat the process whenever the product changes.
Digital Souls Studios LTD designs and builds high-performance websites, web applications, SaaS products, and AI-enabled platforms, with SEO and performance work available for existing sites as well as new builds. Visit Digital Souls Studios LTD to discuss a performance audit, a redevelopment project, or a measured plan for improving your critical mobile journeys.